
BuncheeOnline
ติดต่อเรา
วิธีติดตั้ง Grafana Cloud แบบ Free Plan บน Ubuntu 24.04 Server ด้วย Grafana Alloy Agent เพื่อ Monitor CPU, Memory, Disk, Network และ Logs แบบ Real-time

ถ้าคุณมี Server บน Cloud เช่น Hetzner, AWS EC2 หรือ DigitalOcean แล้วยังไม่มีระบบ Monitoring คุณอาจจะไม่รู้เลยว่า Server ของคุณใช้ CPU, Memory หรือ Disk ไปเท่าไหร่ จนกว่าจะมีปัญหา บทความนี้จะแนะนำวิธีติดตั้ง Grafana Cloud แบบ Free Plan บน Ubuntu 24.04 ด้วย Grafana Alloy Agent ซึ่งเป็นตัว Collector รุ่นใหม่ล่าสุดจาก Grafana Labs
หลายคนเริ่มต้นด้วย Server เปล่าๆ Deploy App ขึ้นไป แล้วก็ลืมดูแลมัน จนกว่าจะเจอปัญหาเช่น:
การมี Monitoring Dashboard ช่วยให้คุณเห็นปัญหาก่อนที่มันจะกลายเป็นเรื่องใหญ่
Grafana Cloud มี Free Plan ที่ใช้งานได้จริงสำหรับ Server ขนาดเล็กถึงกลาง:
| Resource | Free Tier Limit |
|---|---|
| Prometheus Metrics | 10,000 active series |
| Logs (Loki) | 50 GB/month |
| Traces (Tempo) | 50 GB/month |
| Profiles (Pyroscope) | 50 GB/month |
| Retention | 14 days |
| Dashboards | Unlimited |
สำหรับ SME หรือ Startup ที่มี 1-3 Servers นี่เพียงพอมากๆ
Grafana Alloy คือ Agent ตัวใหม่ที่มาแทน Grafana Agent เดิม ทำหน้าที่เก็บ Metrics และ Logs จาก Server แล้วส่งไปยัง Grafana Cloud
จากหน้า Add new connection > Linux Server ใน Grafana Cloud จะมี Script สำเร็จรูปให้ copy เช่น:
GCLOUD_HOSTED_METRICS_ID="YOUR_METRICS_ID" \
GCLOUD_HOSTED_METRICS_URL="https://prometheus-prod-XX.grafana.net/api/prom/push" \
GCLOUD_HOSTED_LOGS_ID="YOUR_LOGS_ID" \
GCLOUD_HOSTED_LOGS_URL="https://logs-prod-XXX.grafana.net/loki/api/v1/push" \
GCLOUD_FM_URL="https://fleet-management-prod-XXX.grafana.net" \
GCLOUD_FM_POLL_FREQUENCY="60s" \
GCLOUD_FM_HOSTED_ID="YOUR_FM_ID" \
ARCH="amd64" \
GCLOUD_RW_API_KEY="glc_YOUR_API_KEY" \
/bin/sh -c "$(curl -fsSL https://storage.googleapis.com/cloud-onboarding/alloy/scripts/install-linux-binary.sh)"
Script นี้จะ:
config.alloy พร้อม Endpoint ทั้งหมด# Import GPG key
sudo mkdir -p /etc/apt/keyrings
sudo wget -O /etc/apt/keyrings/grafana.asc https://apt.grafana.com/gpg-full.key
sudo chmod 644 /etc/apt/keyrings/grafana.asc
# Add Grafana repository
echo "deb [signed-by=/etc/apt/keyrings/grafana.asc] https://apt.grafana.com stable main" \
| sudo tee /etc/apt/sources.list.d/grafana.list
# Install
sudo apt-get update
sudo apt-get install alloyถ้าคุณใช้ Install Script จาก Grafana Cloud มันจะ Run แบบ Foreground ซึ่งไม่เหมาะสำหรับ Production เราต้องตั้งค่าเป็น Systemd Service เพื่อให้ Auto-start เมื่อ Reboot
sudo mv ./alloy-linux-amd64 /usr/local/bin/alloy
sudo chmod +x /usr/local/bin/alloysudo mkdir -p /etc/alloy
sudo cp ./config.alloy /etc/alloy/config.alloysudo tee /etc/alloy/env > /dev/null <<EOF
GCLOUD_RW_API_KEY=glc_YOUR_API_KEY_HERE
EOF
sudo chmod 600 /etc/alloy/envsudo useradd --system --no-create-home --shell /usr/sbin/nologin alloy
sudo chown -R alloy:alloy /etc/alloy
sudo mkdir -p /var/lib/alloy
sudo chown alloy:alloy /var/lib/alloyAlloy ต้องอ่าน Systemd Journal Logs ได้:
sudo usermod -aG systemd-journal alloysudo tee /etc/systemd/system/alloy.service > /dev/null <<EOF
[Unit]
Description=Grafana Alloy
Documentation=https://grafana.com/docs/alloy
Wants=network-online.target
After=network-online.target
[Service]
Type=simple
User=alloy
Group=alloy
EnvironmentFile=/etc/alloy/env
ExecStart=/usr/local/bin/alloy run /etc/alloy/config.alloy --storage.path=/var/lib/alloy
Restart=on-failure
RestartSec=10
LimitNOFILE=65536
[Install]
WantedBy=multi-user.target
EOFsudo systemctl daemon-reload
sudo systemctl enable alloy
sudo systemctl start alloysudo systemctl status alloyถ้าทุกอย่างถูกต้อง จะเห็น active (running):
● alloy.service - Grafana Alloy
     Loaded: loaded (/etc/systemd/system/alloy.service; enabled)
     Active: active (running)
Config เริ่มต้นจาก Install Script จะมีแค่ Endpoint สำหรับส่งข้อมูล แต่ยังไม่มีตัวเก็บข้อมูล เราต้องเพิ่ม Node Exporter สำหรับ System Metrics และ Journal สำหรับ Logs
แก้ไขไฟล์ /etc/alloy/config.alloy:
sudo nano /etc/alloy/config.alloysudo systemctl restart alloyDashboard จะแสดงข้อมูลทั้งหมดของ Server:
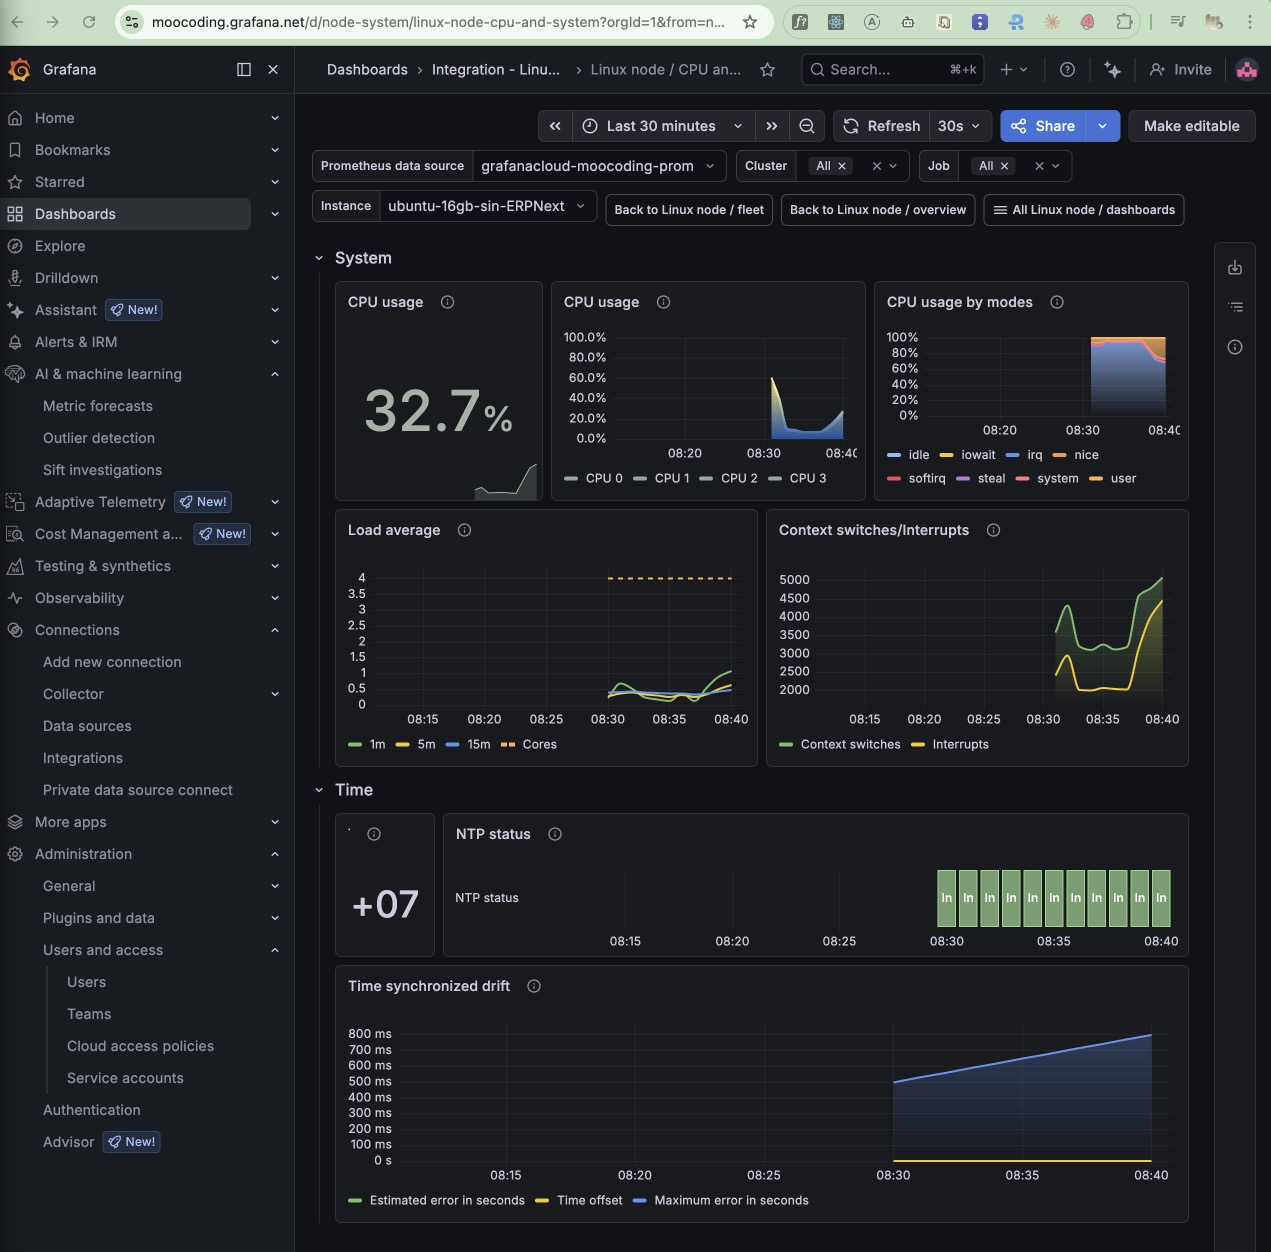
Dashboard ประกอบด้วย:
หลังติดตั้งเสร็จ ไฟล์ทั้งหมดจะอยู่ที่:
| ไฟล์ | ตำแหน่ง |
|---|---|
| Binary | /usr/local/bin/alloy |
| Config | /etc/alloy/config.alloy |
| API Key | /etc/alloy/env |
| Data/WAL | /var/lib/alloy/ |
| Systemd Unit | /etc/systemd/system/alloy.service |
# ดู Status
sudo systemctl status alloy

# Restart หลังแก้ Config
sudo systemctl restart alloy

# ดู Logs ของ Alloy
sudo journalctl -u alloy --no-pager -n 50

# ดู Logs แบบ Follow (real-time)
sudo journalctl -u alloy -f

# Stop/Start
sudo systemctl stop alloy
sudo systemctl start alloyปัญหาที่พบบ่อยที่สุดคือ Alloy User ไม่มีสิทธิ์อ่าน Systemd Journal:
# ตรวจสอบ Group
groups alloy

# ถ้าไม่มี systemd-journal ให้เพิ่ม
sudo usermod -aG systemd-journal alloy
sudo systemctl restart alloy# ดู Error log
sudo journalctl -u alloy --no-pager -n 100 | grep -i error
# ตรวจสอบ Config syntax
/usr/local/bin/alloy fmt /etc/alloy/config.alloy
# ตรวจสอบ API Key
sudo cat /etc/alloy/envGrafana Alloy เป็นตัวแทนของ Grafana Agent ตั้งแต่ปี 2024 โดยมี Config format ใหม่ที่อ่านง่ายกว่า รองรับ Fleet Management และเป็น Open Source ภายใต้ Apache 2.0 License
Grafana Alloy ใช้ RAM ประมาณ 30-50 MB สำหรับ Config แบบ Node Exporter + Journal Logs ซึ่งเบามาก
สำหรับ 1-3 Servers ที่ Monitor แค่ System Metrics และ Logs ใช้ได้สบายๆ Free Plan รองรับ 10,000 Metric Series ซึ่ง Node Exporter ใช้ประมาณ 200-300 Series ต่อ Server
ได้ Grafana Cloud Free Plan มี Alerting ให้ใช้ สามารถตั้ง Alert เช่น CPU > 90% หรือ Disk > 85% แล้วส่ง Notification ไป Email, Slack หรือ Line ได้
systemd-journal group ให้ Alloy user เพื่อให้อ่าน Logs ได้// ============================================================
// Remote Configuration & Endpoints
// ============================================================
remotecfg {
url = "https://fleet-management-prod-XXX.grafana.net"
id = "your-server-hostname"
poll_frequency = "60s"
basic_auth {
username = "YOUR_FM_ID"
password = sys.env("GCLOUD_RW_API_KEY")
}
}
prometheus.remote_write "metrics_service" {
endpoint {
url = "https://prometheus-prod-XX.grafana.net/api/prom/push"
basic_auth {
username = "YOUR_METRICS_ID"
password = sys.env("GCLOUD_RW_API_KEY")
}
}
}
loki.write "grafana_cloud_loki" {
endpoint {
url = "https://logs-prod-XXX.grafana.net/loki/api/v1/push"
basic_auth {
username = "YOUR_LOGS_ID"
password = sys.env("GCLOUD_RW_API_KEY")
}
}
}
// ============================================================
// Linux Node Exporter (CPU, Memory, Disk, Network)
// ============================================================
discovery.relabel "integrations_node_exporter" {
targets = prometheus.exporter.unix.integrations_node_exporter.targets
rule {
target_label = "instance"
replacement = constants.hostname
}
rule {
target_label = "job"
replacement = "integrations/node_exporter"
}
}
prometheus.exporter.unix "integrations_node_exporter" {
disable_collectors = ["ipvs", "btrfs", "infiniband", "xfs", "zfs"]
filesystem {
fs_types_exclude = "^(autofs|binfmt_misc|bpf|cgroup2?|configfs|debugfs|devpts|devtmpfs|tmpfs|fusectl|hugetlbfs|iso9660|mqueue|nsfs|overlay|proc|procfs|pstore|rpc_pipefs|securityfs|selinuxfs|squashfs|sysfs|tracefs)$"
mount_points_exclude = "^/(dev|proc|run/credentials/.+|sys|var/lib/docker/.+)($|/)"
mount_timeout = "5s"
}
netclass {
ignored_devices = "^(veth.*|cali.*|[a-f0-9]{15})$"
}
netdev {
device_exclude = "^(veth.*|cali.*|[a-f0-9]{15})$"
}
}
prometheus.scrape "integrations_node_exporter" {
targets = discovery.relabel.integrations_node_exporter.output
forward_to = [prometheus.relabel.integrations_node_exporter.receiver]
}
prometheus.relabel "integrations_node_exporter" {
forward_to = [prometheus.remote_write.metrics_service.receiver]
rule {
source_labels = ["__name__"]
regex = "up|node_cpu_seconds_total|node_load1|node_load5|node_load15|node_memory_MemTotal_bytes|node_memory_MemAvailable_bytes|node_memory_MemFree_bytes|node_memory_Buffers_bytes|node_memory_Cached_bytes|node_disk_read_bytes_total|node_disk_written_bytes_total|node_disk_io_time_seconds_total|node_filesystem_size_bytes|node_filesystem_avail_bytes|node_network_receive_bytes_total|node_network_transmit_bytes_total|node_boot_time_seconds|node_context_switches_total|node_intr_total|node_filefd_allocated|node_filefd_maximum|node_os_info|node_uname_info|process_max_fds|process_open_fds"
action = "keep"
}
}
// ============================================================
// Systemd Journal Logs
// ============================================================
loki.relabel "integrations_node_exporter" {
forward_to = [loki.write.grafana_cloud_loki.receiver]
rule {
target_label = "job"
replacement = "integrations/node_exporter"
}
rule {
target_label = "instance"
replacement = constants.hostname
}
}
journal_module "integrations_node_exporter" {
forward_to = [loki.relabel.integrations_node_exporter.receiver]
}
declare "journal_module" {
argument "forward_to" {
optional = false
}
loki.source.journal "default" {
max_age = "12h0m0s"
forward_to = [loki.process.default.receiver]
relabel_rules = loki.relabel.default.rules
}
loki.relabel "default" {
rule {
source_labels = ["__journal__systemd_unit"]
target_label = "unit"
}
rule {
source_labels = ["__journal__boot_id"]
target_label = "boot_id"
}
rule {
source_labels = ["__journal__transport"]
target_label = "transport"
}
rule {
source_labels = ["__journal_priority_keyword"]
target_label = "level"
}
forward_to = []
}
loki.process "default" {
forward_to = argument.forward_to.value
}
}